


Voluntary Biodiversity Market in 21 charts
A quick glimpse

Hi folks,
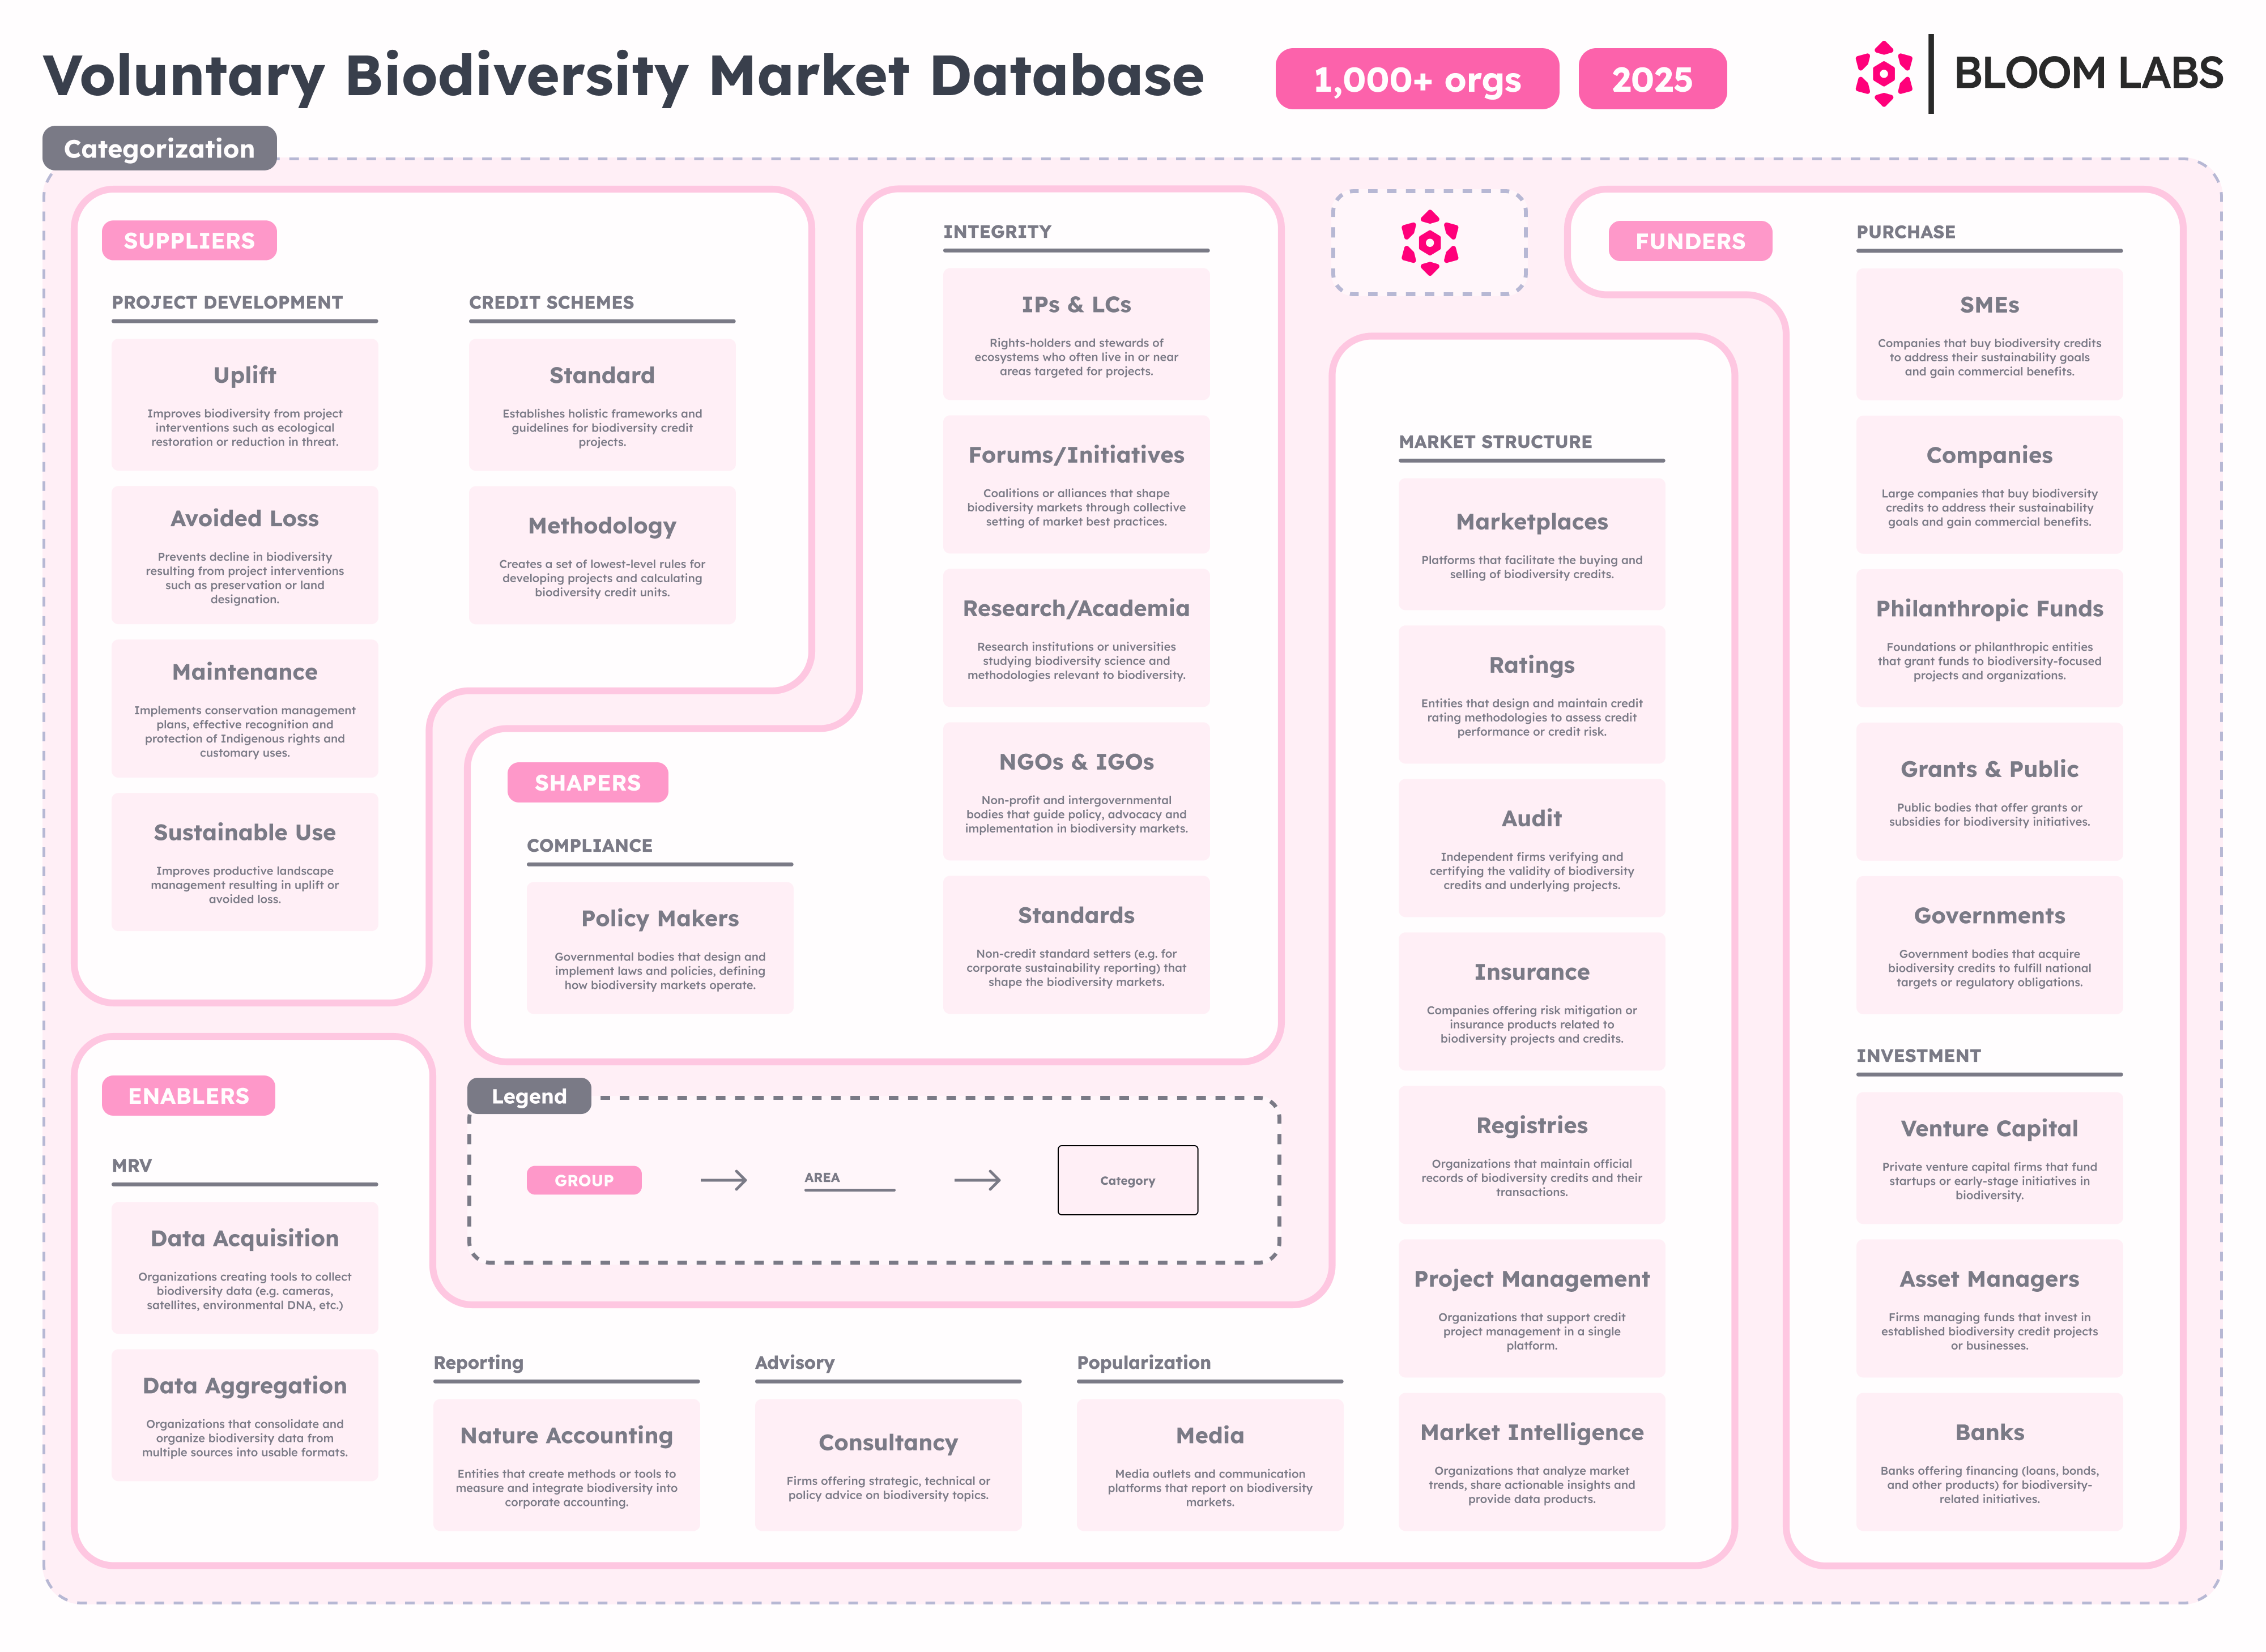
Last week we launched the most comprehensive Voluntary Biodiversity Market (VBM) database out there with over 1,000 carefully described and categorized organizations. To access it, just become a free subscriber of Bloom Labs. You’ll find the database link in the welcome email.
Today, we’ll share some more high-level analysis of that data. Here’s the real-time data dashboard that I’ll dive into now (works best in desktop!).
Later on, we’ll dig into specific market segments of Suppliers, Shapers, Funders and Enablers.
This is also an experiment in more frequent (but narrower) posts. Tell me what you think about it!
📚 Suggested resources
2024 to 2025: what changed?
Frankly, there haven’t been many structural changes.
The COP16 deliverables (e.g. the high integrity framework for biodiversity credit markets, partnership announcements and some sales) helped but didn’t change the picture. Credit sales reached new annual highs but we still can’t call VBM a market - just some one-off transactions.
Voluntary biodiversity and carbon markets are just as deeply interlinked as before. And although there are attempts to separate the two altogether, I don’t see any signs of that happening just yet.
More organizations have explicitly entered the market, doubling from ~500 to more than a 1,000 with a similar split across each group. And since we launched the database last week, we’ve received over 25 submissions to be included in the database - there are clearly even more market players.
Overview

The majority of players are service providers - organizations that want to sell or help others sell biodiversity credits. Enablers comprise 36.8% (421 organizations) while Suppliers make up 32.7% (374). It makes sense- organizations that expect to make money are the most active early on. The barriers to entry for them are quite low, especially if they decide not to use any of the more established (hence expensive) standards (e.g. Plan Vivo or Verra).
The number of best-practice setters (i.e. Shapers) is inherently limited and the buyers (i.e. Funders) tend to flock the scene only once they see a clear return on investment. Here’s one positive sign though: the proportion of Funders have increased the most compared to other Groups this year.

The market is global almost by design. Even at such an early stage, we see organizations from 74 countries and 6 continents participate. UK, US and continental Europe lead the way with Australia, Brazil and Colombia following behind.
Given that the majority of the remaining biodiversity is in the Global South, I wish we saw more local organizations in the market. I’m sure we’ve missed many that are more difficult to find but it’s undeniable that most of the influential organizations reside in Europe and the US. If we (the Global North) are serious about systemically valuing nature and rewarding their stewards, we have to give up a lot of control to the local organizations on the ground. As good as the wishes might be, the current situation still perpetuates inequality.

By far the majority of organizations operate globally (i.e. across more than one continent). That’s easier for service providers that do not operate on the ground. However, many Project Developers are active across countries and continents as well. Although biodiversity credits are more local than carbon credits, we see companies reusing similar playbooks across continents.
The core Groups
As shared in the article last week, the database is built on the Group-Area-Category structure (shown below), with Group being the highest and Category the lowest level. We’ve prioritized keeping organizations in a single Group but if they’re clearly operating across multiple realms, we've made sure to reflect that.
Let’s look into each:
Suppliers
Suppliers are organizations that create biodiversity credit projects (i.e. project developers) or set the rules for their creation (e.g. credit schemes).


Unsurprisingly, Project Developers is the largest category, outnumbering Credit Schemes 5 to 1. We also see that ~20% of the organizations do not only specialize as Suppliers. Quite some advisories, MRV providers and marketplaces help develop projects or do so themselves. We also have some Investors (usually natural capital asset managers) and Purchasers (usually corporates that directly depend on nature) who are exploring or developing biodiversity credit projects themselves. If corporates find value in developing their own projects instead of “pre-ordering” or buying them over-the-counter, it will be a crucial moment for the market. And finally, we see some Shapers directly participate in the market as well. These are usually large conservation NGOs that run a big portfolio of projects on the ground and are exploring repackaging some of them into biodiversity credit projects.
Shapers
Shapers are organizations that focus on shaping the voluntary biodiversity market with influential reports, public resources and commentary, instead of participating in market transactions. They are usually non-profits (e.g. IAPB, BCA, WEF or NatureFinance) with some for-profit advisory exceptions (e.g. Pollination, McKinsey or CDC Biodiversité). Most are alliances, associations, initiatives, collectives and research institutions.
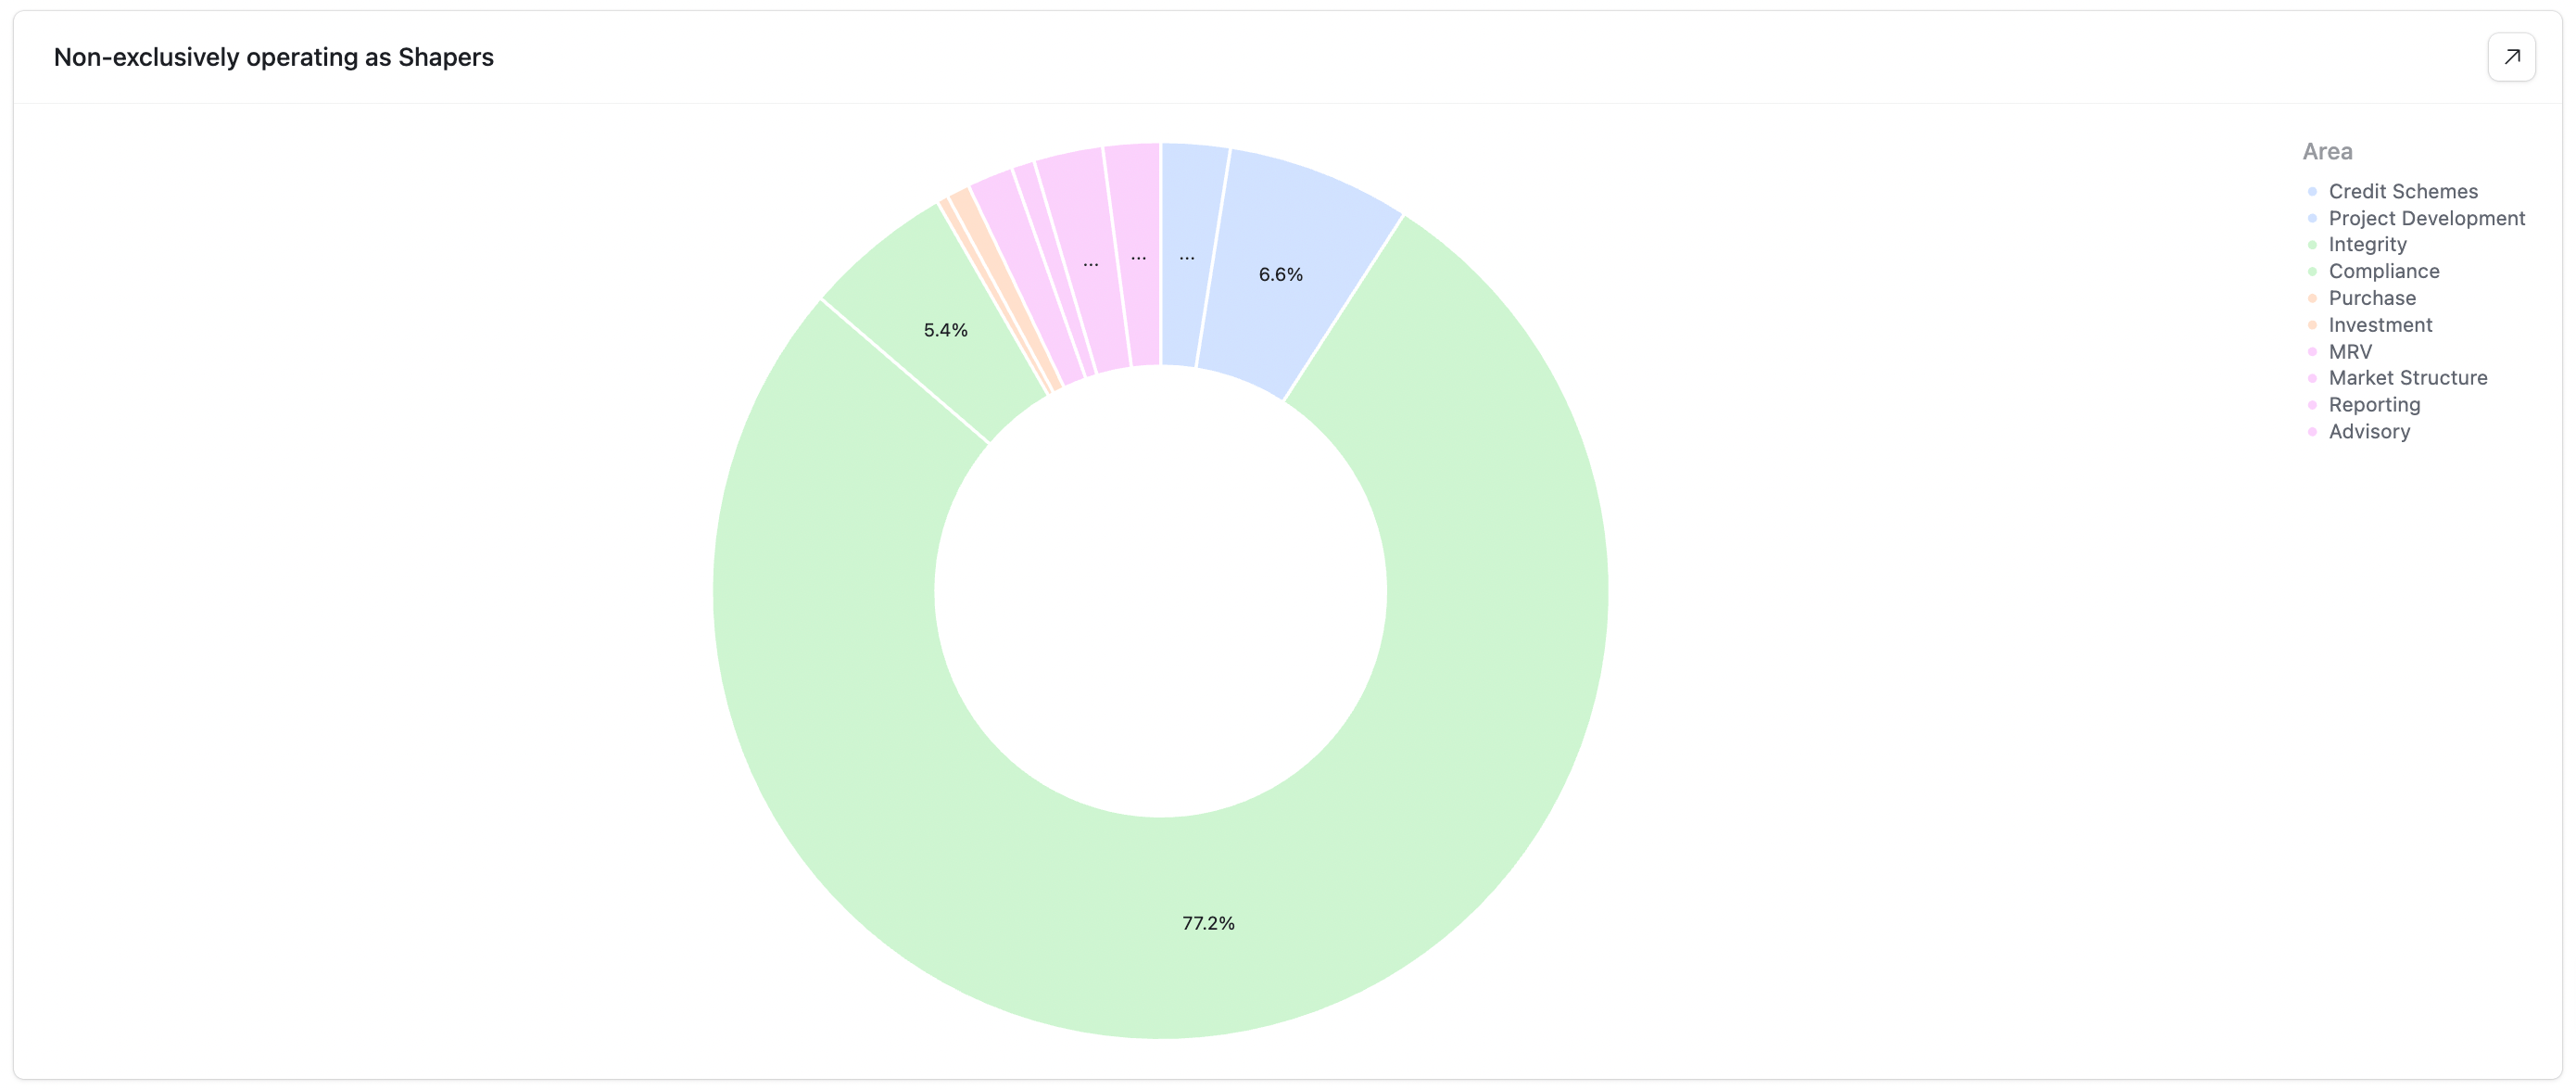

Since it is a voluntary market, non-governmental organizations focused on ensuring the integrity and best practices of the market (coined as Integrity) dominate the Shaper Group with 150 players. However, there are some governmental entities involved in the market as well. Natural England & Defra in the UK, DCCEEW & the Clean Energy Regulator in Australia and the European Commission with its related counterparts in the EU are the most influential ones, both in their own jurisdictions and outside.
Funders
Funders are organizations that purchase biodiversity credits or invest in biodiversity credit projects or companies that serve the market. It’s a diverse group representing private, public and blended finance at different levels.


The split between Purchasers and Investors is pretty even, with Investors being the slight majority. Ideally, Purchasers would be the more dominant group. Voluntary biodiversity market is built on the expectation that more corporate Purchasers will come to foot the bill. They are the backbone of a functioning market. Investors, just like in any market, only have something to invest in if there are end buyers. Having said that, it’s good to see 50+ companies that have purchased biodiversity credits (or have explicitly expressed interest in the market), the majority of them being corporates.
The organizations that are both Funders and Project Developers are usually natural capital asset managers and large forestry/pulp & paper companies. It is difficult to tell if they are looking to buy credits or sell them.
Enablers
Enablers are organizations that serve the market. They are usually for-profit companies providing technology, advisory or media services.


It’s a pretty even split between measurement, reporting & verification (MRV) providers and consultants, trailed by market structure, reporting and popularization providers.
A significant part of MRV providers offer industry-agnostic tech. It can be used not only for monitoring biodiversity for credit projects but also for environmental impact assessments, carbon markets or fulfilling compliance obligations (e.g. EUDR). That’s why there are so many of them. We’ve been especially careful not to include additional hundreds of remote sensing providers who could also serve the biodiversity market. We’ve only added the ones who’ve shown explicit interest in the market.
Advisories (or consultants) is another popular category. In early markets, they are usually the first to offer custom services. VBM is not an exception. Building a scalable product is usually much more difficult (and can be much less in demand).
Market structure is the most diverse class in the database. They are the grease that keeps the wheels of the market turning. I’ll dig into them in another issue.
We then have the corporate reporting (or nature accounting) providers that help companies 1. report on nature via the new frameworks like TNFD or (the watered down) CSRD and 2. truly integrate nature into corporate decision making. It’s a split between usually large advisories and software startups.
The last one is popularization. These are the media companies that explicitly cover the voluntary biodiversity market or organize related events.
Main characteristics
Let’s move on to the main characteristics that the VBM organizations can be defined by.
Tech

From the tech perspective, it’s a diverse split with AI and remote sensing leading the way among the 276 tagged organizations. AI is becoming ubiquitous, especially in remote sensing, acoustics and imaging. It’s just so handy in habitat or species classification. A significant chunk also uses blockchain in data management. It’s especially useful when handling information one can’t easily verify (which is environmental markets in a nutshell). The remaining technologies are divided at 3-8% each.
Focus

Focus reflects the activities that define an organization. Out of the 906 tagged organizations, nature-based solutions (NBS) and carbon dominate, both representing a third of the database each. Every carbon player is also an NBS player, so we decided not to duplicate these tags. This is also where the biodiversity <> carbon overlap becomes so clear. Close to half of the (generally) for-profit players (i.e. Suppliers, Funders and Enablers) come from the voluntary carbon market (VCM).
The remaining significant tags (from highest to lowest) are MRV, agriculture, risk, marine, forestry and biodiversity footprinting.
Social
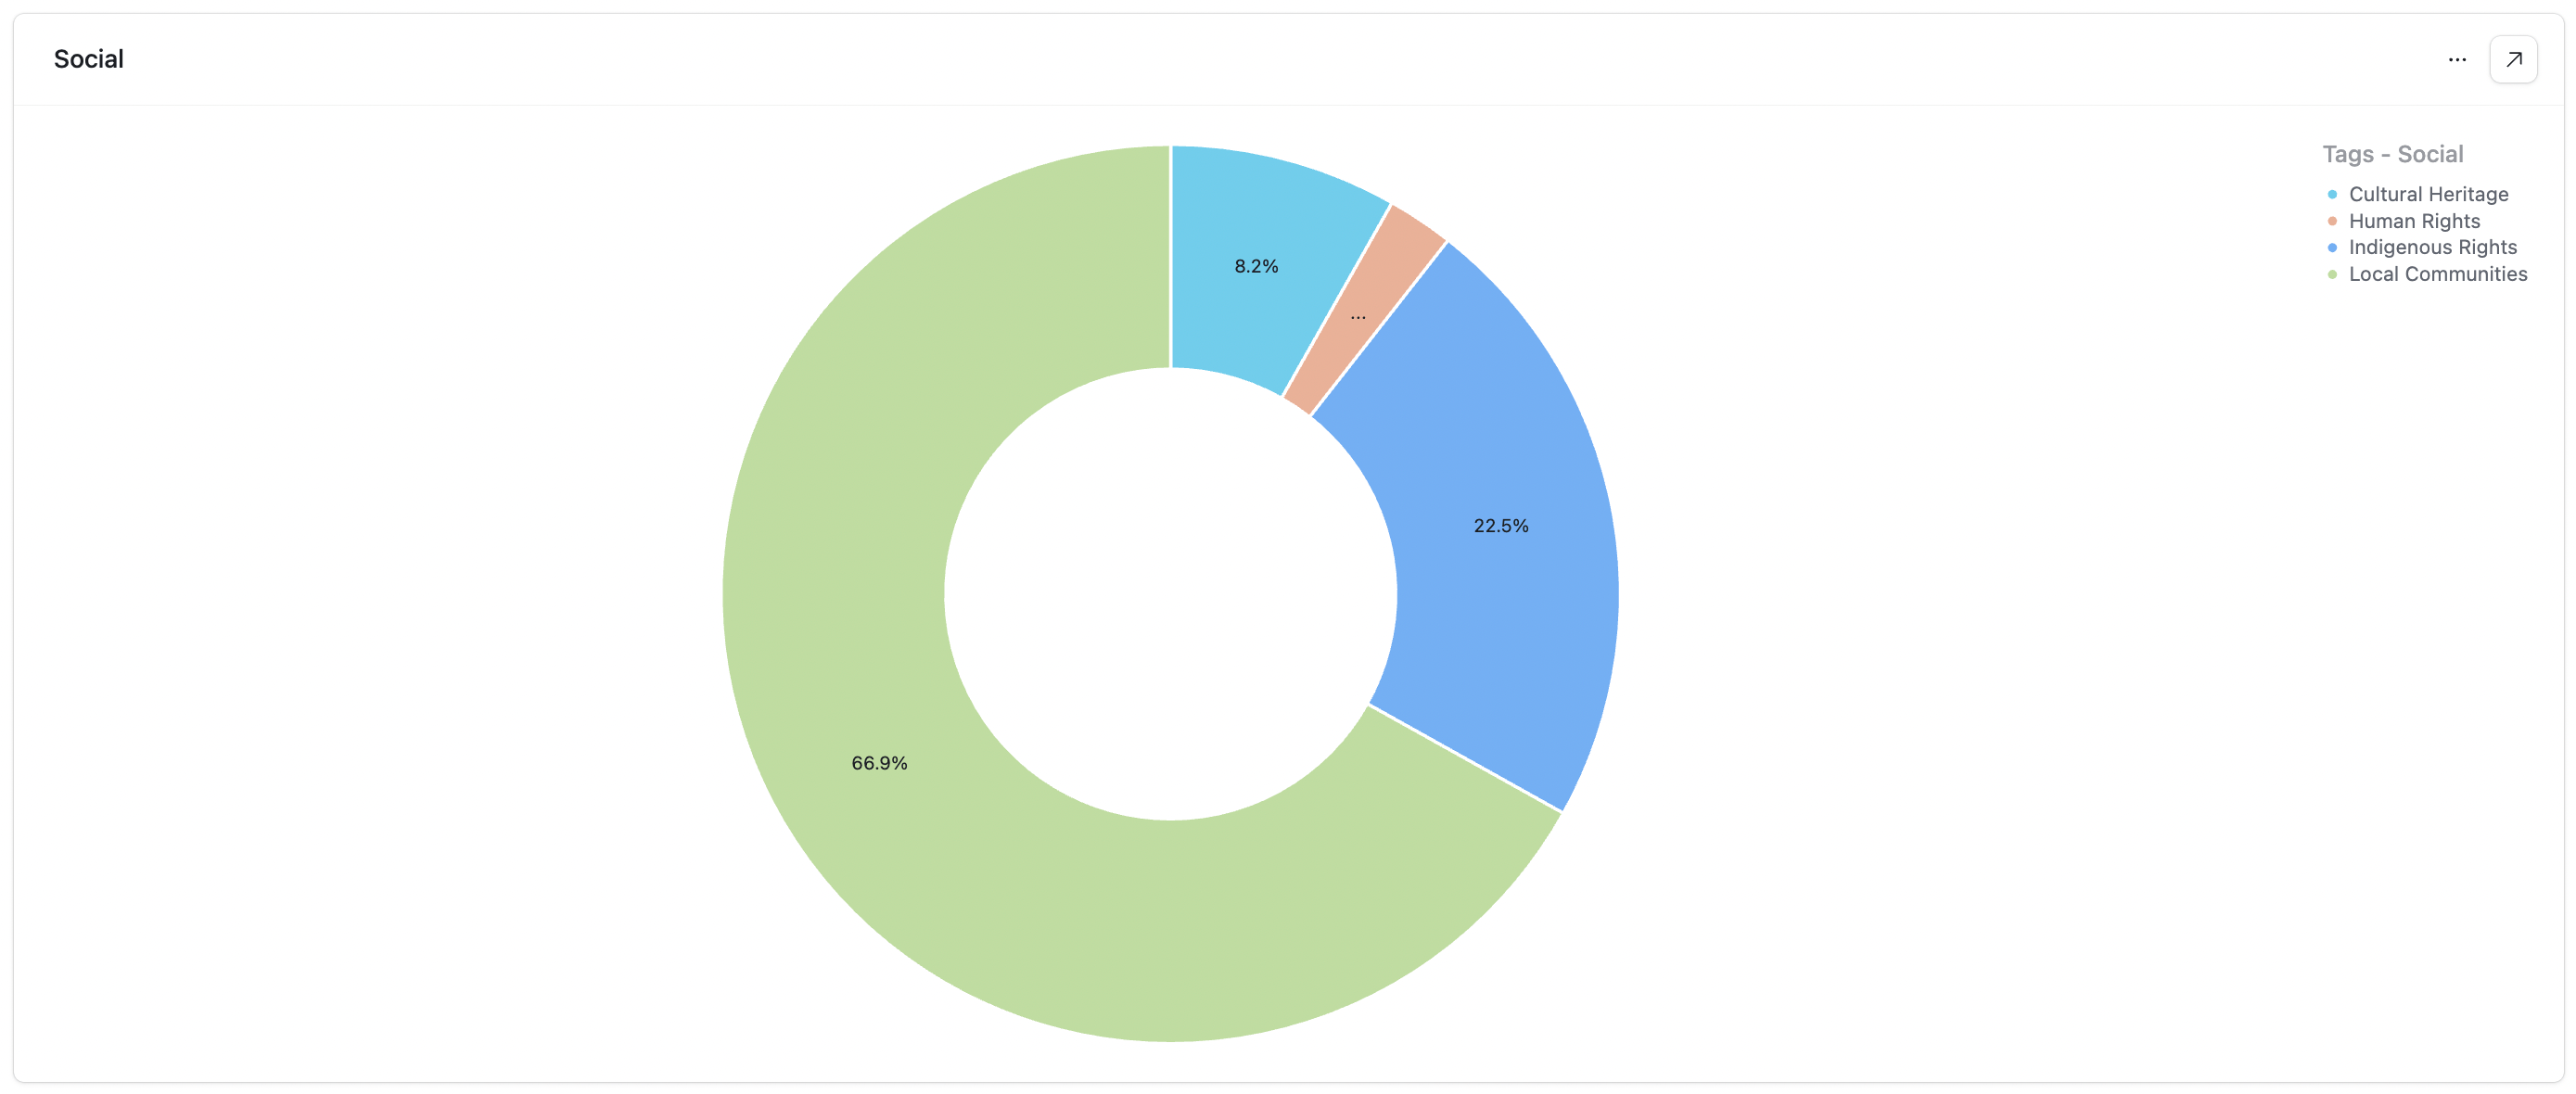
Social tags are crucial but the most difficult to predictably categorize. One could argue that virtually every organization values local communities or human rights. However, we decided to only use these tags for organizations that are defined by these goals. That’s why only 201 organizations were tagged.
Local community focus dominates with Indigenous rights following right after. The remaining focus points are cultural heritage and human rights.
Commercial partners
We were also curious to see which are the most relevant commercial entities for the organization (e.g. clients, partners, investors, etc.). We wanted to map out who the organizations do business with.
For Suppliers

Here the logic is pretty clear: Project Developers target credit Purchasers and Investors while Credit Schemes (and some Investors who dabble in Project Development themselves) target Project Developers.
For Shapers

Since the majority of Shapers are non-profits, this assessment is not very relevant to them. The only exceptions are some conservation NGOs, research institutions and a couple of advisories that are also involved in project development - these usually also target Purchasers and Investors.
For Funders
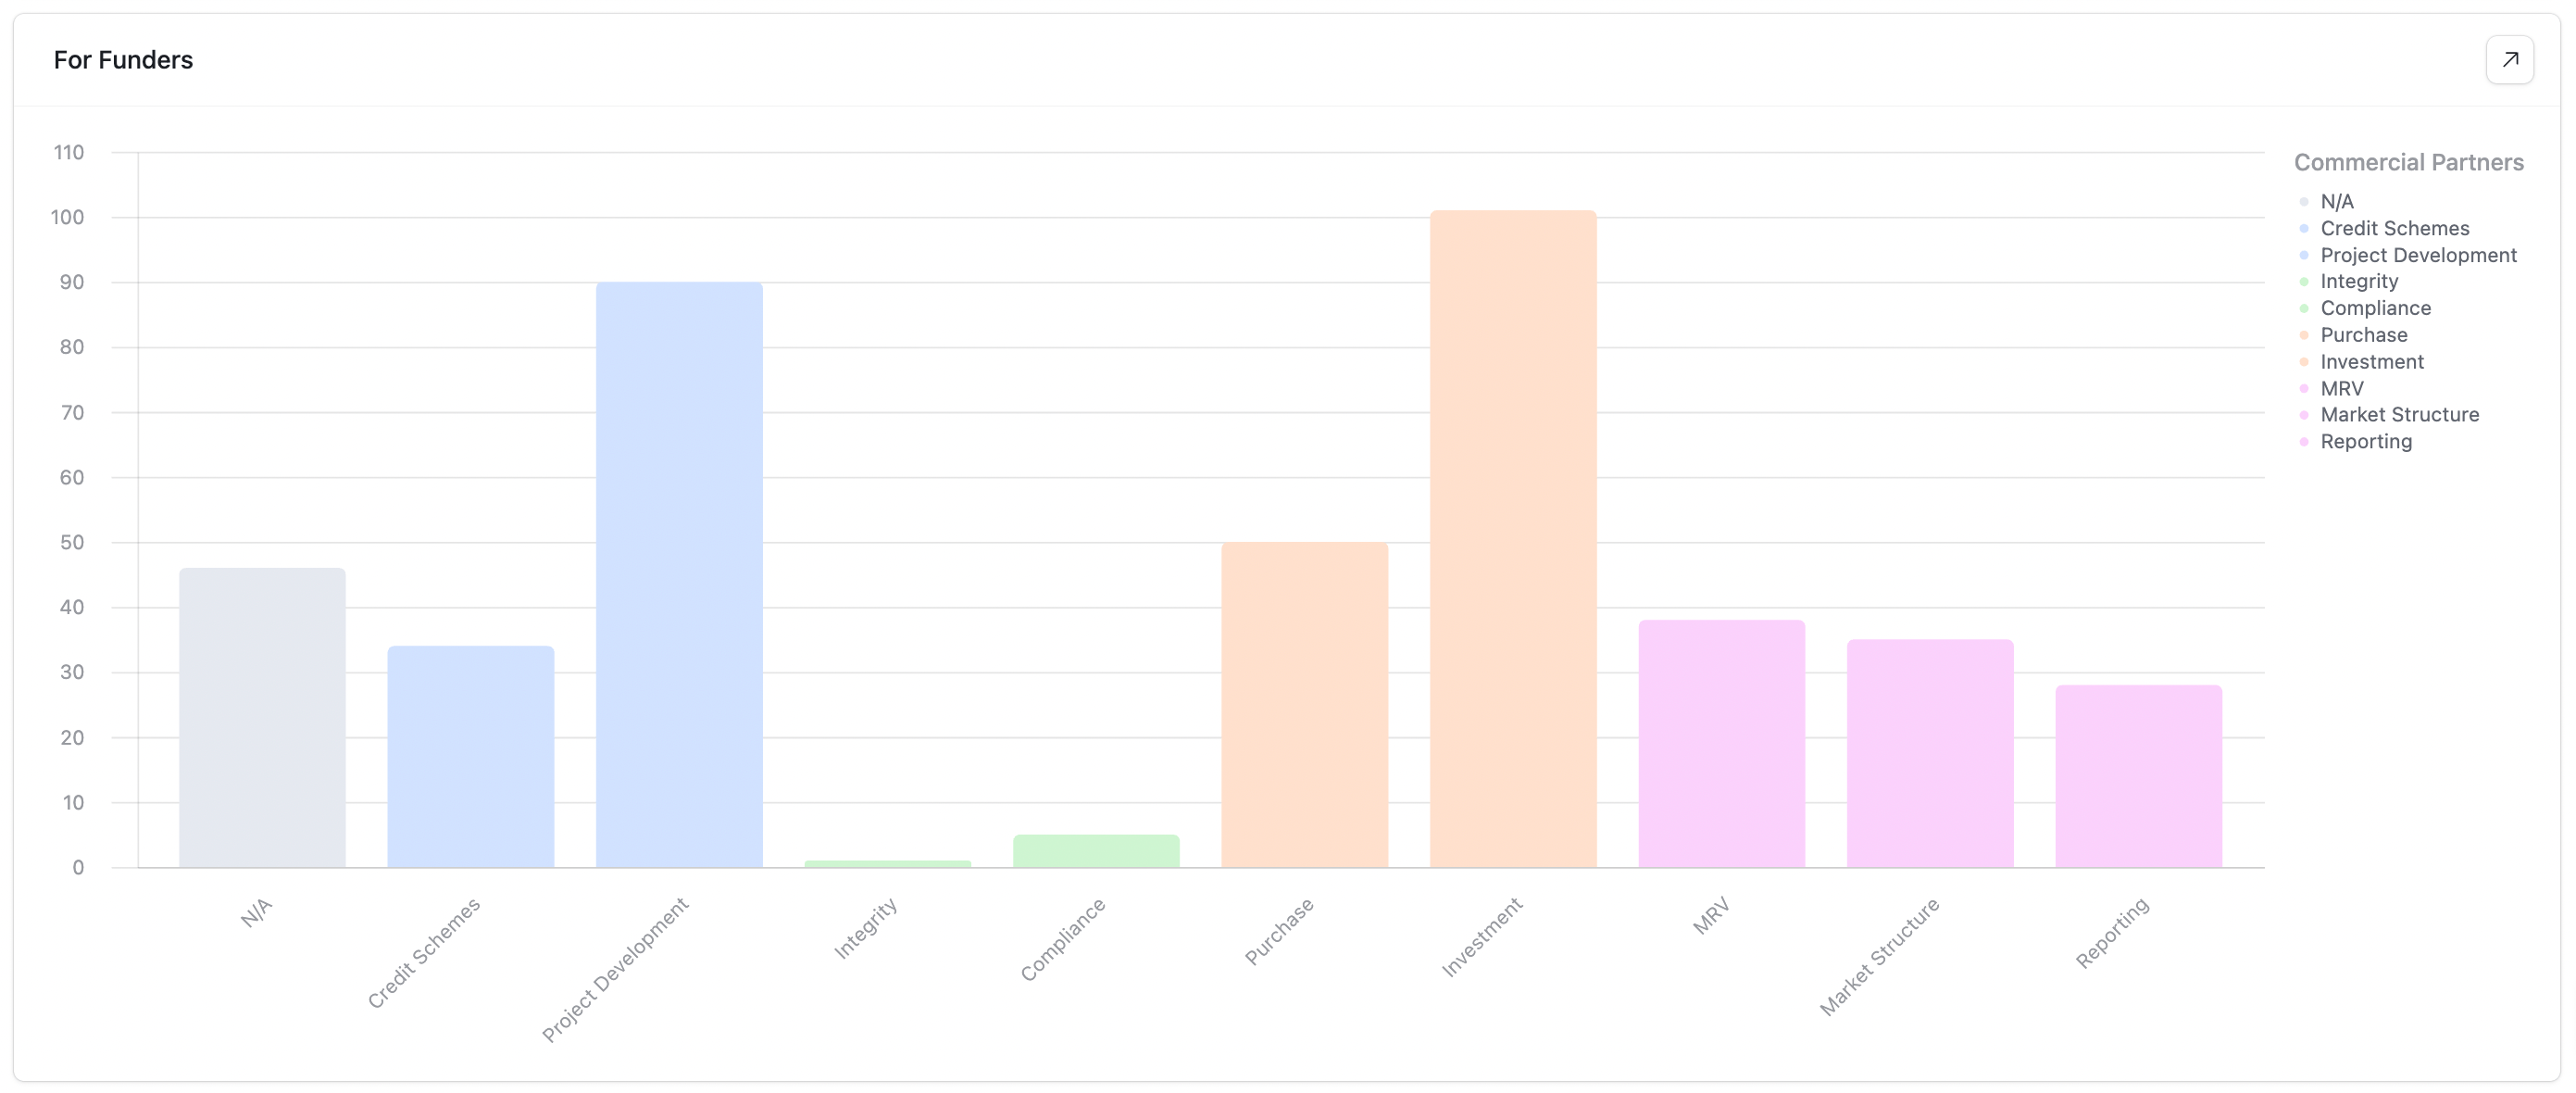
The Funders have the most diverse set of commercial partners.
Non-financial institution Purchasers seem to mostly focus on the credit purchase (hence a significant N/A column). Most aren’t looking for ways to make a direct profit. The remaining Purchasers focus on Project Developers, other Purchasers and Investors. This last group is dominated by banks and insurers that could either invest in projects/credits, be the end buyer or develop their own credit projects.
The Investors are mostly comprised of asset managers, banks & insurers and venture capital firms. Asset managers work with similar partners as banks & insurers but usually have a stronger focus on developing their own biodiversity credit projects. Venture capital firms invest in tech-enabled companies that usually reside in the Enablers and Suppliers categories.
For Enablers

Enablers serve the market usually via advisory and tech solutions. That’s why Project Development, Purchase & Investment are once again the dominant areas, followed by Compliance & Credit Schemes.
Industry connections

And here we see the most popular industry alliances in VBM. Unsurprisingly, Biodiversity Credit Alliance (BCA) dominates, followed by Nature Tech Collective (NTC), Capitals Coalition and International Advisory Panel on Biodiversity Credits (IAPB).
Company data
Organization size

Small companies are by far the most common in the market with over 68% of them being below 50 employees. The company count steadily decreases until it reaches the 500-employee mark. Then we see an uptick. In other words, the market is mostly comprised of very small and very large organizations.
Founding year

The voluntary biodiversity market is brand new and the data shows it. More than half of the organizations were founded in the last 9 years, 38% of them being started in the 2019-2023 window. We might have seen a slump in 2024 but I wouldn’t rule out the younger companies being less visible and us missing them. We’re also seeing a healthy company turnover: 5-10% of the organizations in the 2024 database went out of business.
Parting thoughts
Here are a couple of themes that define the voluntary biodiversity market:
We are still at the market stage where there are more discussions, confusion and research than action. It often is a required stage. However, the result of it is that only two types of organizations are “eating” now: consultants and NGOs.
VBM is developing quickly. New yearly market entrants, increasing credit sales and the proportion of freshly founded companies illustrate that well.
The biodiversity <> carbon overlap is undeniable. Most for-profit players come from the voluntary carbon market (VCM) and have all the incentives to see both markets thrive. If VBM ever becomes more independent from VCM, it is not now.
The market is oversupplied and under-demanded - a natural dislocation in early markets. Although improving, this cannot continue forever. Most Suppliers are suffering and investing in the future of this market.
It will be very interesting to see *how* corporates operate in this market. Will it be by purchasing 3rd party credits over-the-counter? Will it be by pre-ordering 3rd party credits (i.e. made to order)? Or will it be by developing credit projects for themselves? If so, will they use these credits themselves or try to sell them? These decisions will shape the market.
It is possible to make sense of VBM
VBM is confusing (and often confused). But it is possible to understand it better and act on it (and do so in hours/days not weeks/months).
Imagine a single platform where you could find every stakeholder that matters to you. Where you could track the latest market developments. Where you could access timely market analysis. Where you could understand different types of credits and source projects. Where you could see credit pricing. Where you could integrate your biodiversity market activities with your work in the voluntary carbon market.
We want to build that. And for that, we need your help. If you are interested in an even more powerful VBM market intelligence product, please fill in this 3-minute survey:
Thank you to everyone who filled it in so far! It’s been incredibly valuable - we’re planning the next steps directly based on your feedback.
Cheers!
wow very comprehensive! well done!
Well done for the great overview